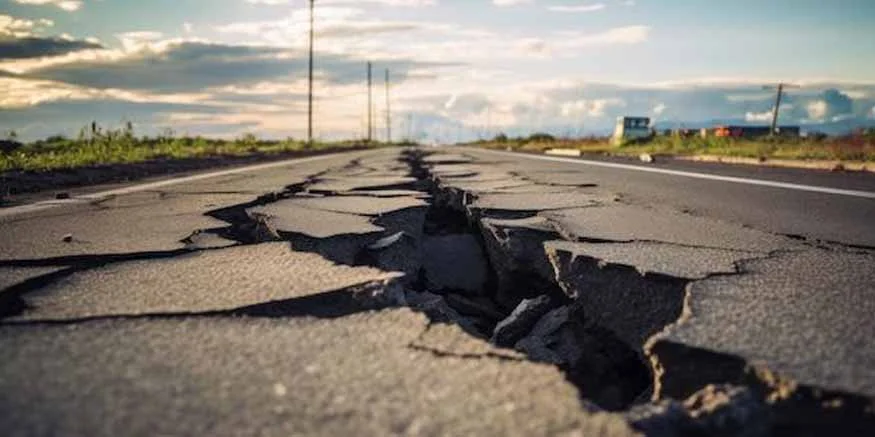
Measuring earthquakes is a complex task that requires a deep understanding of seismology and the principles behind it. From the moment an earthquake occurs to the data being analyzed by scientists, there are several steps involved in measuring these powerful natural events.
The process begins with the detection of seismic waves produced by the quake. These waves travel through the Earth’s interior and can be felt at various distances from the epicenter. Seismographs are specialized instruments that record the movement caused by the seismic waves as they pass through a specific location on the surface.
A seismograph is essentially an accelerometer connected to a pen or stylus that records the vibrations produced by the earthquake on a long strip of paper called a seismogram. As the seismic waves travel through the Earth’s crust, they cause the ground beneath the seismograph to move up and down, creating wiggles on the seismogram.
The intensity of an earthquake is determined using the Richter scale, which was developed by Charles Francis Richter in 1935. The scale measures the magnitude of an earthquake, but not its severity or impact. In other words, it provides a numerical value representing the size of the seismic waves produced by the quake as they travel through the Earth.
The Richter scale is logarithmic, with each whole number increase representing a tenfold amplification in amplitude. This means that if an earthquake registers 7 on the Richter scale, its force is ten times greater than one registering 6. To put it into perspective, a magnitude-3 quake might produce vibrations too small to be felt by humans, while a magnitude-8 or higher would likely cause widespread damage and loss of life.
There are also other scales used to measure earthquakes such as the moment magnitude scale which was developed in the 1970s. This scale takes into account the size of the rupture area, the average amount of slip on the fault, and the amount of energy released during an earthquake.
In addition to these scales, seismologists have various tools at their disposal for analyzing data from earthquakes. They use statistical techniques to determine the number of seismic events that occur within a given period of time and in specific areas. By studying these patterns, researchers can identify trends and make predictions about future occurrences.
The analysis also includes the study of fault lines as well as the shape and structure of the Earth’s crust. This allows scientists to develop models for how earthquakes happen and what factors contribute to their severity.
